 Welcome to ATP Education
 ATP Education
Science Exploration Notes Class 9 English Medium 2026-27
Science Exploration Notes Class 9 English Medium 2026-27 now available for students studying in cbse school, up board, state boards and international cbse schools and Latest CBSE Curriculum based on NCERT books.

Science Exploration Notes Class 9 English Medium 2026-27
All topics of Chapter 4 Describing Motion Around Us
1. Chapter Review and Key Points 2. Motion in a Straight Line 3. Measuring Motion 4. Types of Motion 5. Graphical Representation of Motion 6. Assignments - What Have You Learned?Science Exploration Chapter 4. Describing Motion Around Us
CBSE Notes New Syllabus: Class 9
Assignments - What Have You Learned?
Chapter 4. Describing Motion Around Us
This section explains the graphical representation of motion. Motion graphs help us understand how the position, speed, velocity and acceleration of an object change with time. They make it easier to compare different types of motion and solve numerical problems.
25. Graphical Representation of Motion
A graph is a visual method of representing the relationship between two physical quantities. In the study of motion, graphs are drawn by taking time on the X-axis (horizontal axis) and another physical quantity on the Y-axis (vertical axis).
Importance of Motion Graphs
- Easy Interpretation – Motion can be understood quickly.
- Comparison – Different types of motion can be compared easily.
- Numerical Problems – Helps calculate speed, velocity, acceleration and displacement.
- CBSE Competency Questions – Graph-based questions are frequently asked in examinations.
26. Position–Time Graph
A position-time graph shows how the position of an object changes with time.
Axes
- X-axis – Time (t)
- Y-axis – Position (x)
Interpretation
- Horizontal Line – Object is at rest.
- Straight Inclined Line – Uniform motion.
- Curved Line – Non-uniform motion.
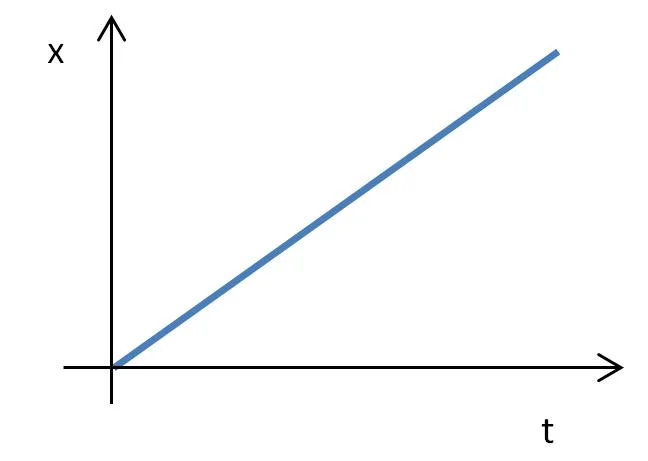
Figure (i) Position–Time Graph
- Horizontal line → Object at rest
- Straight inclined line → Uniform velocity
- Curved line → Changing velocity
Slope of Position-Time Graph
The slope of a position-time graph represents the velocity of the object.
27. Distance–Time Graph
A distance-time graph shows how the distance travelled by an object changes with time.
Axes
- X-axis – Time
- Y-axis – Distance
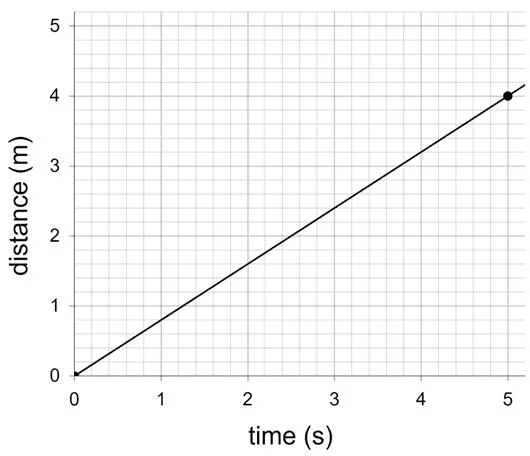
Figure (ii) Distance–Time Graph
- Straight line → Uniform speed
- Curved line → Non-uniform speed
- Slope = Speed
Interpretation
| Graph | Meaning |
|---|---|
| Horizontal Line | Object is at rest. |
| Straight Line | Uniform speed. |
| Curved Line | Changing speed (non-uniform motion). |
Important Point
The slope of a distance-time graph gives the speed of the object.
28. Velocity–Time Graph
A velocity-time graph shows how the velocity of an object changes with time.
Axes
- X-axis – Time
- Y-axis – Velocity
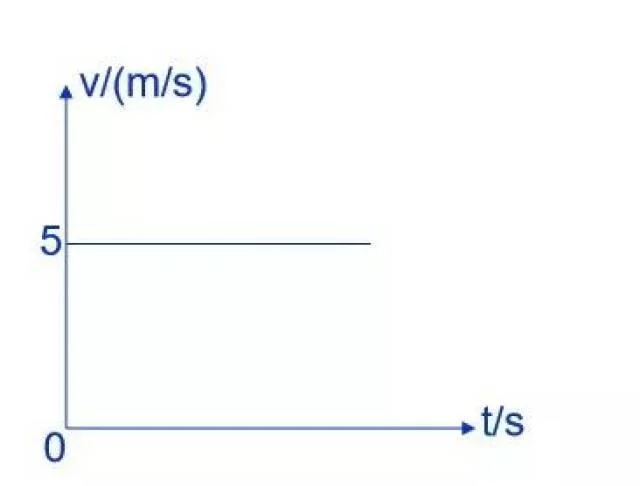
Figure (iii) Velocity–Time Graph
- Horizontal line → Constant velocity
- Slope = Acceleration
- Area under graph = Displacement
Interpretation
- Horizontal Line – Uniform velocity.
- Upward Sloping Line – Positive acceleration.
- Downward Sloping Line – Negative acceleration (retardation).
- Line on X-axis – Zero velocity.
Slope of Velocity-Time Graph
The slope of a velocity-time graph gives the acceleration.
Area Under Velocity-Time Graph
The area enclosed between the graph and the time axis represents the displacement of the object.
29. Acceleration–Time Graph
An acceleration-time graph shows how the acceleration of an object changes with time.
Axes
- X-axis – Time
- Y-axis – Acceleration
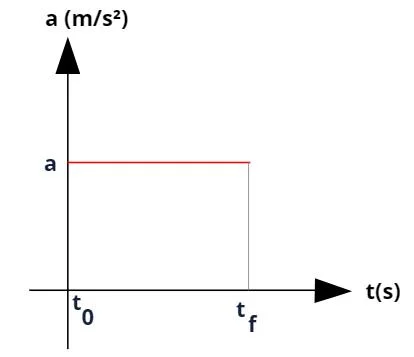
Figure (iv) Acceleration–Time Graph
- Horizontal line above X-axis → Constant acceleration
- Below X-axis → Retardation
- On X-axis → Zero acceleration
Interpretation
- Horizontal Line Above X-axis – Constant positive acceleration.
- Horizontal Line Below X-axis – Constant negative acceleration.
- Line on X-axis – Zero acceleration.
30. Graph Interpretation Skills
Students should carefully observe the shape and slope of a graph before drawing conclusions.
Quick Rules
- Steeper Distance-Time Graph – Greater speed.
- Steeper Position-Time Graph – Greater velocity.
- Steeper Velocity-Time Graph – Greater acceleration.
- Horizontal Graph – Quantity remains constant.
- Curved Graph – Quantity changes continuously.
31. Difference Between Motion Graphs
| Graph | Slope Represents | Area Represents |
|---|---|---|
| Position–Time | Velocity | Not Used |
| Distance–Time | Speed | Not Used |
| Velocity–Time | Acceleration | Displacement |
| Acceleration–Time | Rate of Change of Acceleration | Change in Velocity (Advanced Concept) |
32. Common Mistakes Made by Students
- Confusing Distance-Time and Position-Time Graphs – Remember that position includes direction, while distance does not.
- Ignoring the Slope – Always calculate or observe the slope before answering.
- Misinterpreting Curved Graphs – A curve usually indicates changing speed or velocity.
- Forgetting Units – Always write proper SI units on graph axes.
33. ATP Education Exam Booster
- Position–Time Graph → Slope = Velocity.
- Distance–Time Graph → Slope = Speed.
- Velocity–Time Graph → Slope = Acceleration.
- Velocity–Time Graph → Area under the graph = Displacement.
- Horizontal Line → Quantity remains constant.
- Straight Inclined Line → Uniform motion.
- Curved Line → Non-uniform motion.
ATP Education Tip
Graph-based questions are among the most scoring questions in CBSE examinations. Always remember these three golden rules: Distance-Time Graph → Speed, Position-Time Graph → Velocity, Velocity-Time Graph → Acceleration and Area → Displacement. Once these relationships are clear, most graph-based questions become easy to solve.